Data visualization
| For Assay files | |
|---|---|

|
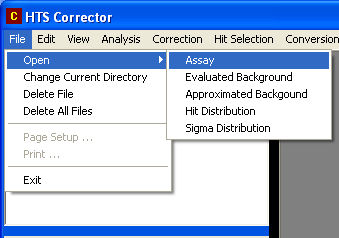
Open an assay file |
|
|
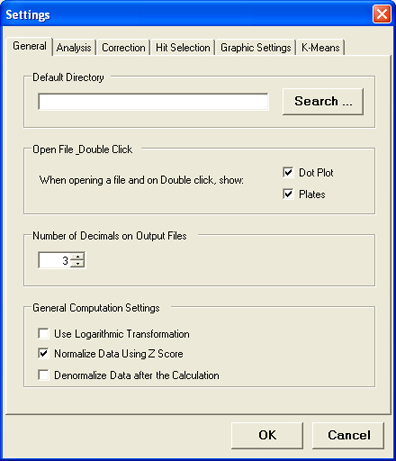
Set the default action on opening or double-clicking a file ( Properties and Settings : General ) |
|
|
Double-click on the file name |
| Or | |
|
|
Check the file name |
|
|
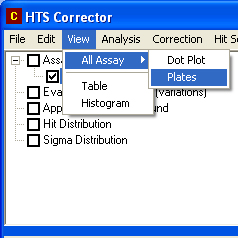
Select View => All Assay => Dot Plot or Plates |
|
|
Select View => Table |
| For single plate file | |
|
|
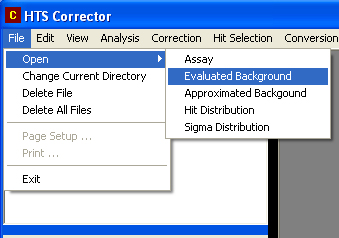
Open a background, approximated background, hit distribution or sigma distribution file |
|
|
Double-click the file name for a colored plate visualisation |
| Or | |
|
|
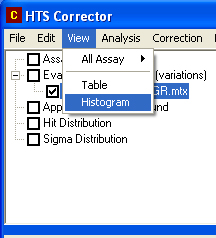
Check the file name |
|
|
Select View => Table to visualize the plate measurements |
|
|
Select View => Histogram for the row and column histogram visualisation |
|
|
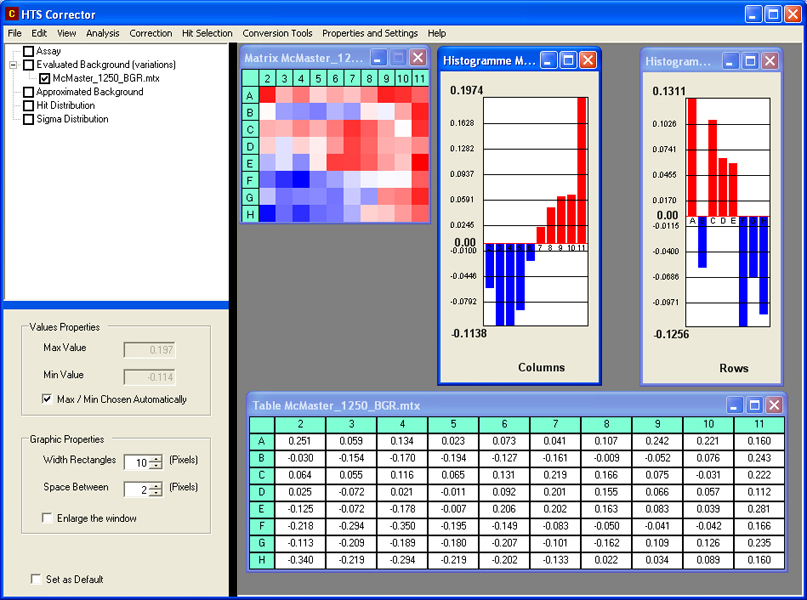
The selected graphic (dot plots, assay plates, tables or histograms) will be displayed. |
|
|
Change the visualization parameters on the bottom left panel (optional) |
For Assay files

For single plate file