File Formats
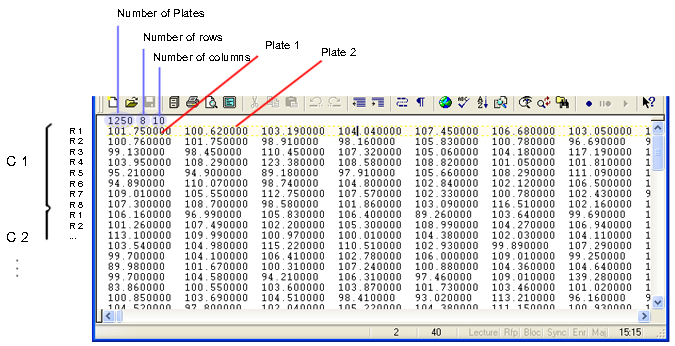
| Assay format 1 (old assay format .mtr) | |
|---|---|

|
The first line indicates the number of plates, rows and columns of the assay |
|
|
Each column is associated with a plate |
|
|
In the picture below Ri represents the value of the row i and Cj the values of the column j |
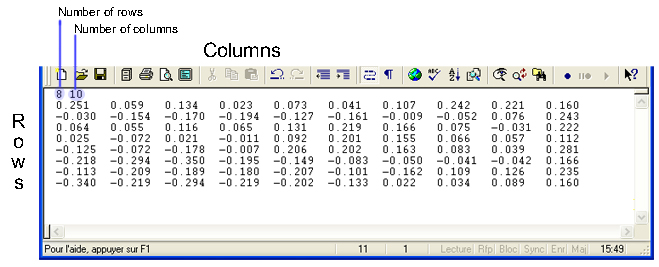
| Plate format 1 (old plate format .bgr, .apr, hit, sgm) | |
|---|---|
|
|
The first line indicates the number of rows and columns of the plate |
|
|
This format is associated with the actual plate format |
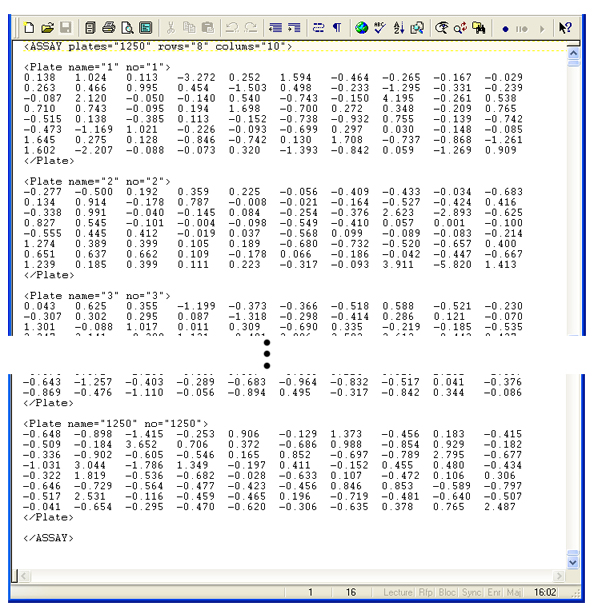
| Assay format 2 (new assay format .mtx) | |
|---|---|
|
|
This is an XML-like format (but not strictly XML) |
|
|
The first line indicates the file type and the number of plates, rows and columns of the assay |
|
|
The file type can be ASSAY or HITS |
|
|
Each plate should have a name. The plate number is optional |
|
|
This format is associated with the actual plate format |
|
|
You have to close each tag with </tagName> |
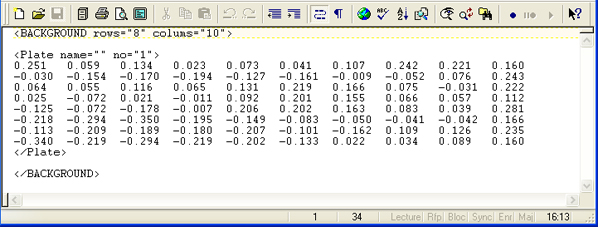
| Plate format 2 (new plate format .mtx) | |
|---|---|
|
|
This is an XML-like format (but not strictly XML) |
|
|
The first line indicates the file type and the number of rows and columns of the plate |
|
|
The file type can be BACKGROUND, APPROXIMATION, HIT_DISTRIBUTION, or SIGMA_DISTRIBUTION |
|
|
Each plate should have a name. The plate number is optional |
|
|
This format is associated with the actual plate format |
|
|
You have to close each tag with </tagName> |
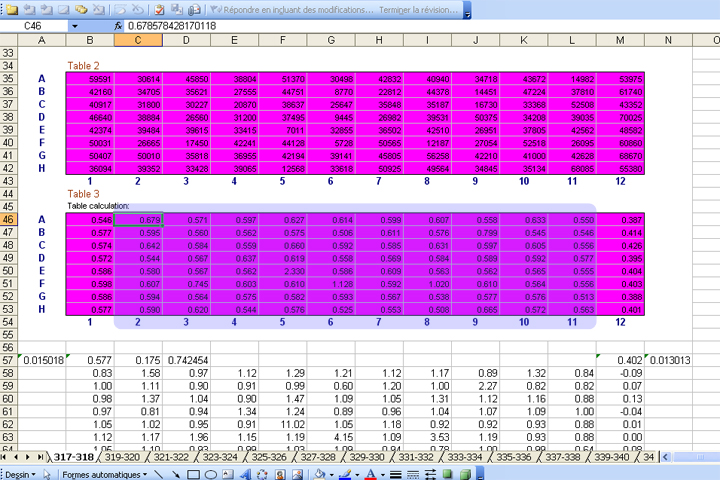
| Excel format | |
|---|---|
|
|
You can use any kind of Excel format, but the entries have to be numerical values |
|
|
Fill the empty wells with the plate mean and make sure that all Excel sheets have the plate values in the same zone (in the picture below the selected zone is 46 - C to 53 - L) |
|
|
Remove all empty or incorrect sheets from the file |
|
|
HTS Corrector will parse the entire Excel file and take the plate values from the selected zone. The sheet names will become the plate names |
|
|
The values in the non-selected zones will not influence the result. You can put there all kind of aditional information |